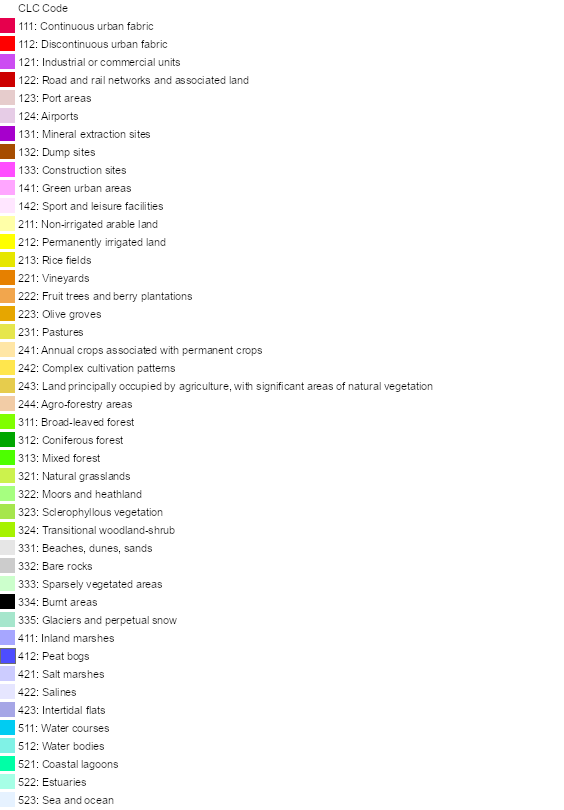
Legend
About
This website is a prototype application developed to view various ways WMS and WFS data could be accessed to produce time series visualizations. The work is not affiliated with any other projects, and is solely to test approaches to visualizing time series in a WebGIS microservice application. This app is intended to contribute to the reasearch for the M.Sc. thesis of Jesse Friend in the International Master of Science in Cartography program. It has been completed in collaboration between the Technical University of Munich, and GAF AG in Munich.
The land cover data layers come from the CLC inventory.
The transportation and reference layers come from the ArcGIS REST Services Directory.
Click HERE, or scan the QR code below to get in touch.